Features
Why you’ll love it.
Thoughtfully designed.
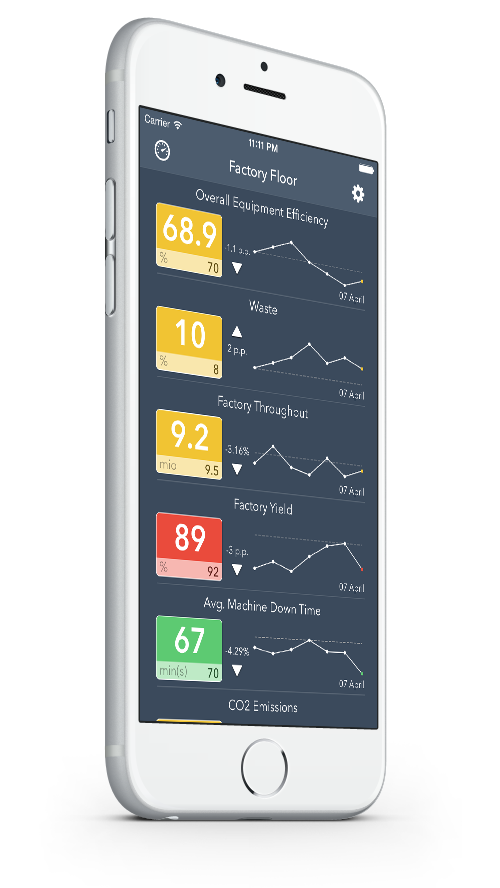
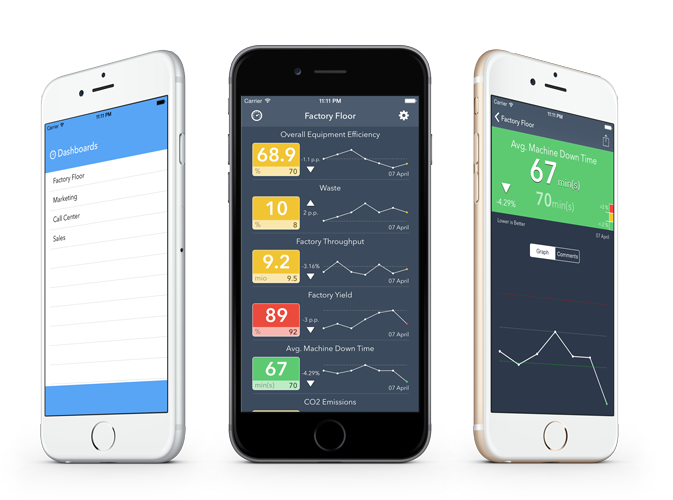
Get to the essentials quickly.
When pocketKPI launches you see an overview of all your KPIs, giving you all the data you need at your fingertips. At a quick glance you can see your KPI’s, their target values and see coloured badges that visually tell you whether the variance to target is within tolerances.
pocketKPI has been crafted with the user as the focus, providing KPI summary data at a glance but making sure detail is just a tap away.
Unlimited number of KPIs.
Add, remove and reorganise KPIs as you see fit.
Because pocketKPI displays your KPIs by reading a data file created by your systems, the flexibility to change what is displayed in the app is entirely up to you.
Forgot to add a KPI or want to change the order they are displayed to your people? Simply change the data file and next time your users perform a data refresh the changes will appear automatically.
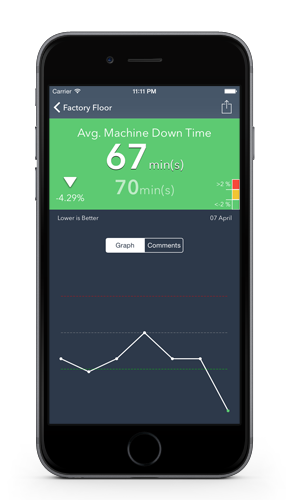
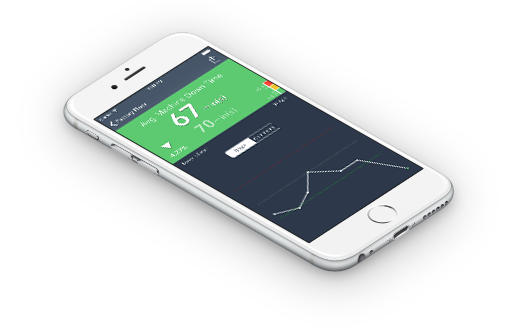
Make KPIs trendy.
Sparklines offer snapshots on past performance.
pocketKPI supports the addition of historical values for a KPI to the data file in order to plot spark lines. These spark lines give a quick and easy snap shot of the trend of a KPI and help put the current value in context.
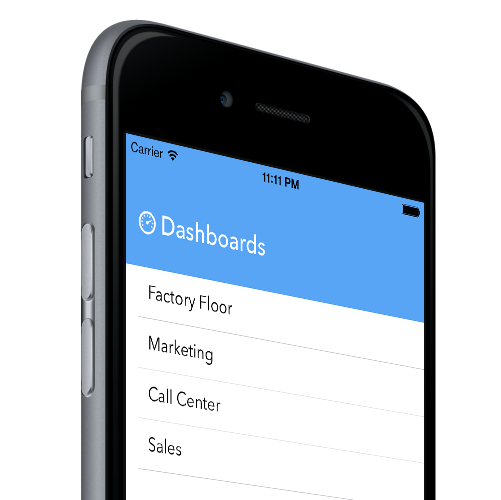
Divide and conquer.
Group KPIs to reflect relevant parts of the business.
With the dashboard feature of pocketKPI you can group together KPIs any way you like. Want to separate out Marketing KPIs from the Sales KPIs? Perhaps you want the same KPIs but divided up into a region or territory? What about dividing them up into quarterly or monthly time periods?
By modifying your data file you can group KPIs in a logical way that suits your business. pocketKPI uses these groupings and shows them in a drawer. Tap a group and see only the KPIs relevant to that area, function or time period. Simple and flexible.
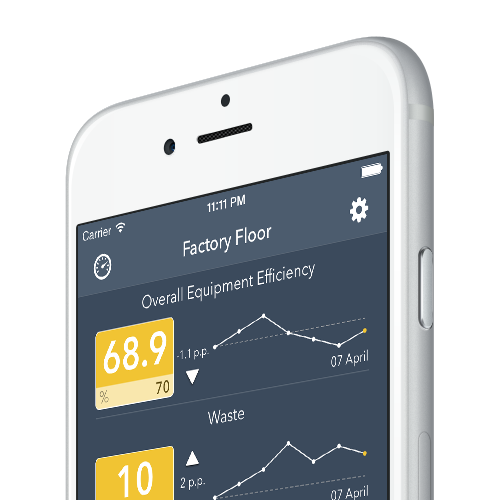
Customise to your needs.
Set tolerances to match your desired performance.
pocketKPI uses tolerances to determine how to colour KPIs and visualise their performance. A tolerance value allows you to determine (as a percentage) how much a KPI value can vary from a target before it gets coloured red, yellow, or green.
You can set a global tolerance for all KPIs (for example ±5%) or you can specify individual tolerances for each KPI in your data file.
Limited only by imagination.
Dozens of industries. Only one app.
Our customers come from a variety of industries. pocketKPI has been used by manufacturers, call centers, hospitals, sales teams, Health and Safety professionals and Software as a Service (SaaS) companies.
pocketKPI’s flexibility lends itself to a variety of uses in a multitude of industries. Need inspiration? Our Sample Files section has examples per industry that might spark your imagination.